
Greenland’s Ice
As part of the Arctic region, the Greenland ice sheet is the second largest in the world. Covering 1.7 million square kilometres, which is 80% of the area of the island, it is one of the largest repositories of freshwater ice and plays an important role with respect to global climate and sea level. The Greenland ice sheet reaches a thickness exceeding 3 kilometres, harbouring an estimated volume of ice equivalent to roughly 7.2 meters of global sea level rise. Its sheer mass exerts a significant influence on regional weather patterns and ocean currents.
Scientific research utilizing satellite observations, ice core samples, and climate models has revealed clear trends in the Greenland ice sheet’s dynamics. Accelerated melting driven by rising temperatures has led to increased runoff and iceberg calving, contributing to rising sea levels worldwide. The loss of ice mass from Greenland has been identified as one of the primary drivers of global sea level rise. Feedback mechanisms exacerbate the ice sheet’s vulnerability to climate change. As ice melts and exposes darker surfaces, such as bare rock or water, the albedo effect intensifies, causing more solar radiation to be absorbed and accelerating further melting in a so-called positive feedback loop.
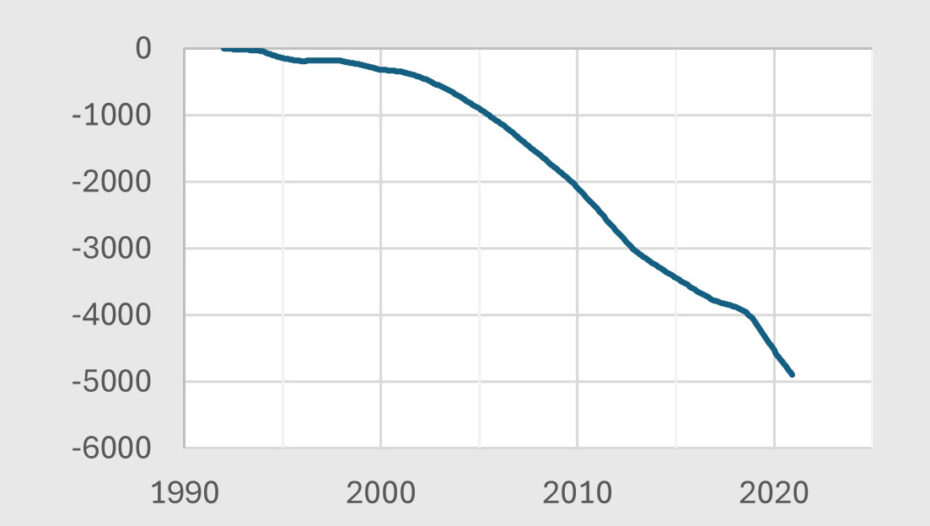
Cumulative ice loss of the Greenland ice sheet in Gt (10^9 tons) (source: IMBIE).
Satellite altimetry measurements provide insights into changes in ice sheet elevation, allowing to monitor variations in ice thickness. This data revealed thinning and mass loss particularly along Greenland’s periphery, where warmer ocean waters accelerate ice melt from below. Satellite imagery offers information on surface features and melt patterns across the ice sheet. High-resolution optical and radar images capture details such as crevasses, melt ponds, and supraglacial lakes, which influence the ice sheet’s development. Radar satellite remote sensing enables the monitoring of ice sheet movement through techniques like interferometric synthetic aperture radar (InSAR). By measuring precise changes in surface elevation, InSAR provides insights into ice flow velocities.
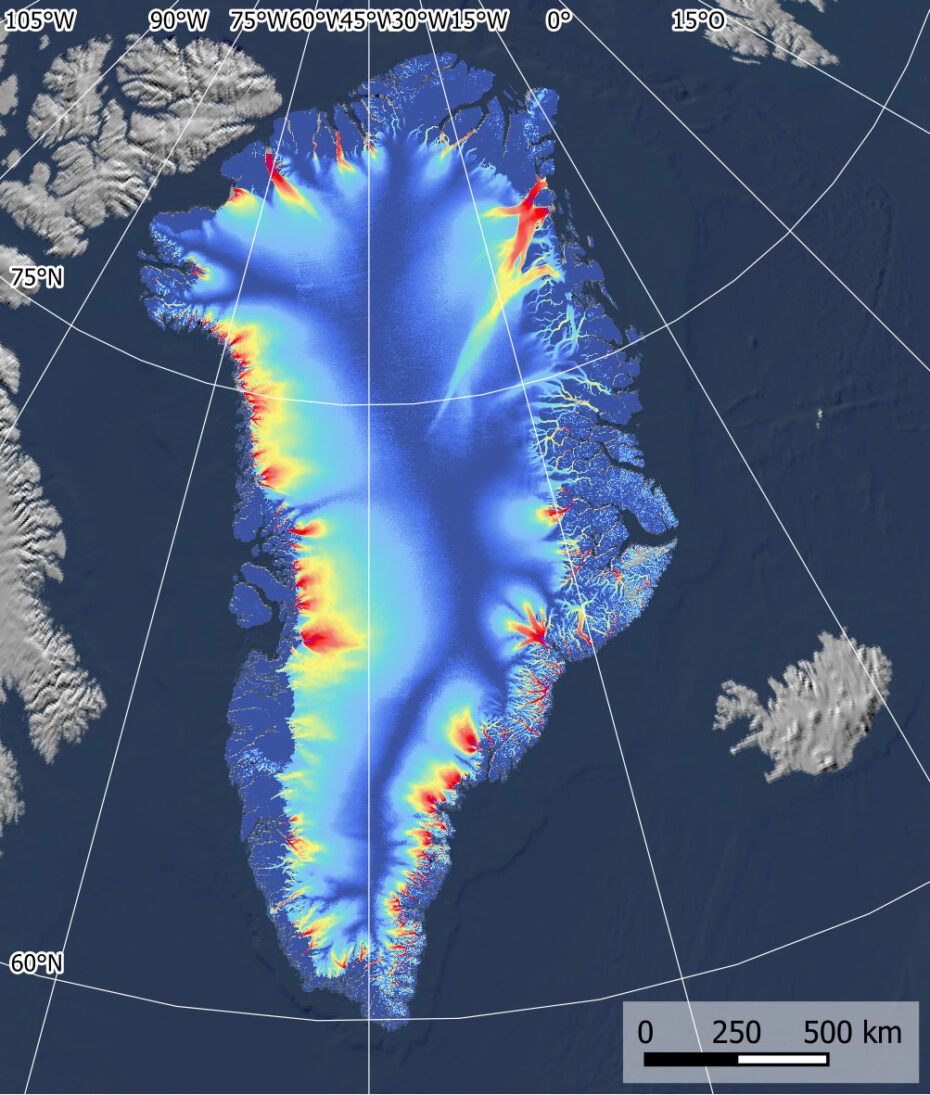
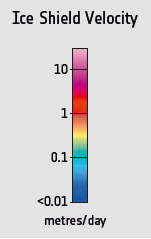
Flow velocity of the ice surface in Greenland derived from Sentinel-1 data (2020).
Exercises
- Satellite Map:
- Look at the false colour infrared (FIR) satellite image from September 2023. Which different landcover types can you identify?
- FIR images usually show vegetation in red colours. Compare the FIR image with the true colour image. Here the vegetation is displayed in a greenish colour. What do think about the intensity of the vegetation shown in the images?
- In the satellite images, water appears in different forms. Try to identify them based on their colours (deep sea water, shallow sea water, water on the ice sheet, ice, snow).
- Ice flows, and the ice sheet velocity map shows different ice velocities. Where can you find the lowest, where the highest velocities? What could be the reason for the differences? Think about the air temperature at different elevations.
- Copernicus Browser:
- Open the case study area in the Copernicus Browser.
- Find the most recent Sentinel-2 dataset covering the area displayed in the satellite map.
- Select a true colour visualisation.
- Can you identify additional, recent changes in the area?
- Select the false colour infrared representation. Can you identify the land-use of the most intensely vegetated areas (represented by bright red colours)?
Links and Sources
| Downloads: | |
|
PDF document of the case study (includes exercises): English, German, French, Italian, Spanish |
|
|
|
This case study is covered on page 43 of the printed ESA Schoolatlas – download the PDF document of the page: English, German, French, Italian, Spanish |
| Links: |
|