

Flash flood in South-Western Europe
In October 2024, one of the most severe natural disasters in recent Spanish history struck the eastern region of Valencia. Between late October and early November, heavy rainfall triggered catastrophic flash flooding that affected towns and countryside across the region.
The floods were caused by an unusual and extremely powerful storm system. A low-pressure system moved over Spain and remained nearly stationary for several days. This system drew large amounts of moisture from the warm waters of the western Mediterranean and Atlantic Ocean, leading to unusual, intense rainfall across eastern and southeastern Spain. In some areas around Valencia, the total amount of rainfall reached more than 300 litres per square metre within less than 24 hours, far exceeding the amount of rain these places normally receive in an entire year.
On 29 October 2024, the rainfall reached its maximum. Rivers such as the Magro, the Turia, and the Poyo overflowed their banks, and water surged across towns, agricultural fields, roadways and railways. The water levels rose so quickly that emergency services had to respond immediately, but many residents had little time to evacuate. The disaster caused enormous human, economic and infrastructural losses. More than 200 people died and hundreds of thousands were affected by the flooding.
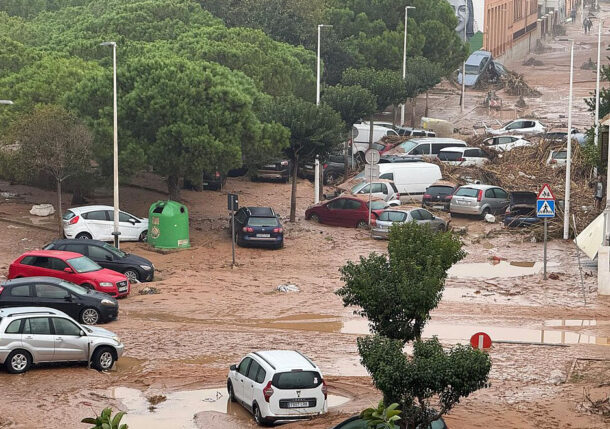
The situation in the town of Catarroja, south of Valencia, on October 30, 2024 (Photograph: Manuel Pérez García and Estefania Monerri Mínguez).
During the floods the freshwater lagoon Albufera, which is part of the Albufera Nature Park, received water from the river Rambla del Poyo on the north and from the paddies flooded by the Magro on the south. The water carried canes, mud, the upper layer of crop fields and garbage, including industrial material, plastic, fuel, and sewage, temporarily deteriorating the water quality in the lagoon.
One of the most important satellite programs for this disaster was Copernicus. Copernicus satellites such as Sentinel-1 and Sentinel-2 were used to map flooded regions around Valencia. Sentinel-1 uses radar, which can “see” through clouds and darkness, enabling analysts to create maps of flooded land even during a storm. Data from Copernicus were quickly turned into flood maps through the Copernicus Emergency Management Service (CEMS). These maps showed which areas were inundated and which regions were at greatest risk, thus helping to plan emergency measures.
Exercises
- Satellite Map:
- Look at the satellite image map, which at the start shows the situation on 2024-10-26, before the flooding event. Try to identify different land cover types (water, vegetation, built-up areas).
- Use the layer selector tool in the upper right of the map to select the image acquired four days later on 2024-10-30, and toggle between the two images by selecting and deselecting this layer. Which changes can you detect?
- Try to characterize the quality of the image of 2024-10-30. What disturbs the quality of the data? Try to identify clouds (and their shadows!). Why is this image used here despite its lower quality? Think about the availability of optical satellite data especially during events related to precipitation.
- Compare the images from 2024-10-26 and 2024-11-20 and focus on the freshwater lagoon in the south-east part of the map (part of the Albufera Nature Park). What differences in the colour of the water can you identify? What could be the reason for the differences? Think about sediments transported by the flood waters.
- Deselect the group of natural colour images and select the NDWI (normalized difference water index) layers. Which type of representation of the data would you prefer for a quick assessment of the flood extent, and why?
- For hungry minds: select the other representations of the event (false colour infrared images, moisture index maps, Sentinel-1 radar images) and try to identify the differences caused by the flood. Which representation types do you consider especially useful, and why?
- Copernicus Browser:
- Open the case study area in the Copernicus Browser.
- Find the most recent Sentinel-2 dataset covering the area displayed in the satellite map.
- Select a true colour visualisation.
- Can you identify additional, recent changes in the area (check e.g. agricultural land and the freshwater lagoon Albufera)?
- Select the false colour infrared representation. Can you identify the land-use of the most intensely vegetated areas (represented by bright red colours)?
Links
| Downloads: | |
 |
PDF document of the case study (includes exercises): English, German, French, Italian, Spanish |
| Links: |
|