
Land reclamation at the North Sea
Before the 20th century, the IJsselmeer did not exist. Instead, there was the Zuiderzee, a saltwater inlet connected to the North Sea. During storms, water from the sea often flooded the surrounding towns and farmland. After a disastrous flood in 1916, the Dutch government approved the Zuiderzee Works, an ambitious plan led by Cornelis Lely to protect the region from flooding and to increase food security by creating new farmland.
The first major step was the construction of the Afsluitdijk, completed in 1932. This dam separated the Zuiderzee from the North Sea, transforming it into a freshwater lake now called the IJsselmeer.
After the Afsluitdijk was completed, engineers began draining sections of the IJsselmeer to form polders, areas of land reclaimed from the water. These polders are surrounded by dikes and kept dry using pumping stations. Four major polders were created: Wieringermeer (1930), Noordoostpolder (1942), Oostelijk Flevoland (1957), and Zuidelijk Flevoland (1968) with the city of Almere, one of the fastest-growing urban areas in the Netherlands. The creation of Flevoland, the newest Dutch province, is a direct result of these reclamation efforts. Currently about 9000 km², more than one fourth of the area of the Netherlands, lies below sea level.
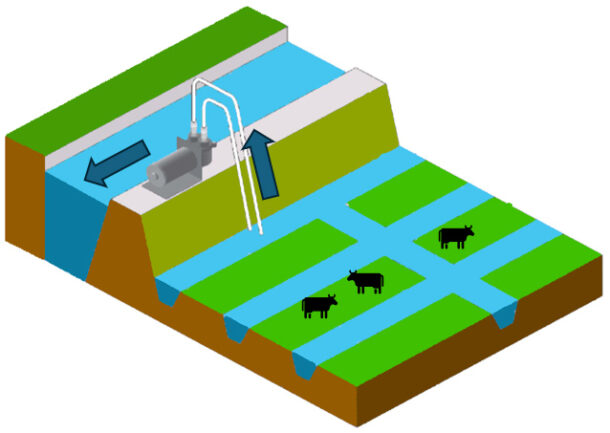
Schematic view of a polder. From areas below sea level water is pumped up to canals flowing to the sea (based on a drawing by Mic Greenberg).
Although the Dutch have managed water for centuries, climate change brings new challenges to the region. Rising sea levels put increased pressure on coastal defences, including the Afsluitdijk, which has recently undergone major reinforcement. Another concern is subsidence, the gradual sinking of reclaimed land. As the polders compact over time and groundwater levels fluctuate, maintaining proper drainage becomes increasingly expensive.
To address these issues, engineers and planners are exploring adaptive solutions such as flexible water-level management, nature-based flood defences, and continued use of advanced monitoring systems, including satellites, to guide decision-making.
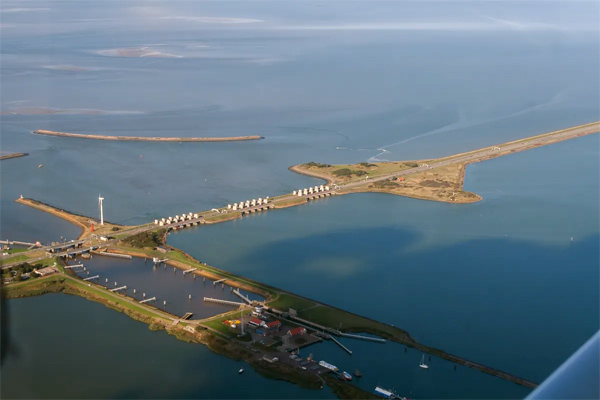
Aerial view of the Afsluitdijk (MD van Leeuwen/CC BY-SA 3.0)
Exercises
- Satellite Map:
- Look at the satellite image maps and use the layer selector in the upper right of the map to switch layers on and off. Focus on the 1964 Argon image and the 2024 Sentinel-2 image. Discuss the changes that occurred in the region between 1964 and 2024 by switching the respective layers on and off.
- Argon was a US reconnaissance satellite which provided B/W films, which were scanned in satellite data centers. Compare the quality of the Argon and the Sentinel-2 images. Which is easier to interprete? Which reasons can you identify? Think e.g. of the information contained in one or in several spectral bands.
- Which factors have originally limited the growth of the agricultural and the settlement areas?
- Try to identify areas in which these limitations have been overcome and describe how this was done.
- Try to identify changes in the land-use in the region and especially the land-use in the newly gained areas.
- Using the measurement tool with the overlay of the land reclamation areas (polders), try to estimate the areas gained by the projects (hint: the results can be checked comparing with the values shown when clicking on the polder areas).
- Copernicus Browser:
- Open the case study area in the Copernicus Browser.
- Find the most recent Sentinel-2 dataset covering the area displayed in the satellite map.
- Select a true colour representation.
- Describe the colours of the water and try to identify factors influencing the colour. Think about the depth of the (shallow) sea, and currents and human activities stirring the sediments up.
- Can you identify additional, recent changes in the area (check e.g. the coastline)?
- Open a recent Sentinel-1 radar image of the case study area in the Copernicus Browser.
- Compare the features visible in the Sentinel-1 image and in the Sentinel-2 image and describe your findings. Focus on the water surfaces in the Sentinel-1 image. Try to identify the nature of the numerous visible dots. What could the single dots represent, what could the rastered areas be? Think about ships or offshore windparks.
Links and Sources
| Downloads: | |
| PDF document of the case study (includes exercises): English, German, French, Italian, Spanish |
| Links: |
|