
Nature Protection in the Alps
The Hohe Tauern National Park lies in the Austrian Alps and covers about 1,856 square kilometres. It is split into a large core zone and an outer zone and is the biggest protected area in the Alps. Its landscape includes high peaks, deep valleys, rivers, forests and some of Austria’s largest glaciers.
Because of its great variety of mountain habitats, the Hohe Tauern is home to many plants and animals. Alpine species such as chamois, ibex, marmots and birds of prey live here, together with a large variety of insects and mountain plants. The park is important both for protecting these species and for scientific study.
Located near Grossglockner, with 3798 m the highest peak in the Eastern Alps, one of the most famous features of the park is the Pasterze Glacier, the longest glacier in Austria. Like other glaciers, the Pasterze is shrinking rapidly and will be lost in the decades after 2050.
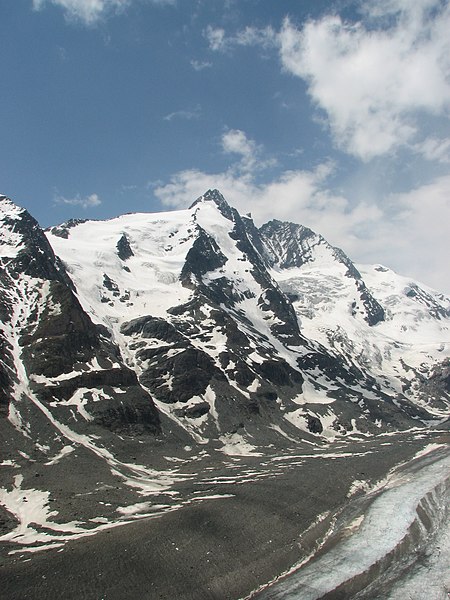
View of the Pasterze glacier in front of the peak of Grossglockner (3798 m). The glacier is largely covered by debris accumulated during its retreat (photograph: mmechtley).
The National Park faces several problems:
- Climate change and glacier retreat: Warmer temperatures mean less snowfall and stronger summer melting. Glaciers are thinning and retreating, which changes water flow and harms species that depend on cold habitats.
- Permafrost thaw and rockfalls: Warmer air warms the ground at high altitude, causing frozen ground (permafrost) to melt. This weakens rock faces and increases rockfalls and landslides, endangering hikers, huts and alpine trails.
- Tourism pressures: Hiking, skiing and mountain tourism bring money and interest in nature, but they also disturb wildlife, and cause erosion.
These problems are linked: less ice changes how mountain slopes behave, and changing weather patterns affect forests and rivers downstream. Park managers therefore balance conservation, research and visitor services to protect sensitive areas while still allowing people to experience the mountains.
Satellites provide data that is ideal for tracking changes over large areas like the Hohe Tauern. Data from European missions such as Sentinel-1 and Sentinel-2 help watch glaciers, snow cover, forests and landslides. By comparing images taken over time, they allow mapping where ice is disappearing, where vegetation is changing, and where rockfall or forest damage has appeared.
Exercises
- Satellite Map:
- Use the layer selector to deactivate all layers except the overview satellite image. Which land cover classes can you identify? Try to find forests, grassland, water bodies, rocks and snow/ice.
- Which other types of land cover and landuse can you identify?
- Use the layer selector to add the layer with the National Park borders. Take a closer look at the borders. Which landcover classes dominate within the National Park? What do you think are reasons to define the National Park in this rugged shape? Think about economic arguments.
- The bigger lakes in the image are storage lakes used for hydropower generation. Check their positions with respect to the National Park borders.
- Deselect the overview image, activate the Sentinel-2 detail image from 2025 (true colour), zoom in, and apply these considerations to the detail image.
- Deselect the Sentinel-2 true colour image and activate the False Colour Infrared (FIR) images. Toggle the 2025 image on and off and compare. What changes can you identify? Focus on the region around the end of the glacier tongue (Pasterze) north of the peak of Grossglockner.
- Repeat the comparison with the Short Wave Infrared (SWIR) images. Which differences compared to the FIR data can you identify?
- Copernicus Browser:
- Open the Copernicus Browser.
- Find the most recent Sentinel-2 dataset covering the area displayed in the satellite map. Is it easy to find cloud-free images? If not, what could be the reason? Think about the climate zone of the region!
- Select a true colour visualisation.
- Can you see any influence of the season in which the data was acquired? What about snow)
- Find a recent image from August or September, the months in which the snow cover reaches its minimum. Select a true colour visualisation. Can you identify additional, recent changes in the area (check especially the coastal region?
- Select the Short Wave Infrared (SWIR) representation. What can you say about the visibility of snow and ice in the SWIR image compared to the true colour visualisation?
Links and Sources
| Downloads: | |
| PDF document of the case study (includes exercises): English, German, French, Italian, Spanish |
| Links: |
|