
Growth of a Megacity
Shanghai, China’s largest city, has experienced rapid growth over the past century. Located on the eastern coast of China, it is an important port city at the mouth of the Yangtze River. Its expansion has been driven by trade, industry, and global investment, making it one of the world’s most influential economic centres.
Shanghai became a major trading hub already in the 19th century due to its strategic location. The establishment of the Shanghai Free-Trade Zone in 2013 further boosted trade. Over the last century, millions of people migrated to Shanghai for job opportunities, leading to an increase in housing, infrastructure, and services. This development was further enhanced, when in 1978 China introduced economic reforms, attracting foreign companies and businesses to Shanghai, leading to rapid industrial and commercial expansion. During this process the city developed an extensive transport network, including high-speed rail, highways, and one of the world’s busiest ports, making it easier for people and goods to move efficiently.
Shanghai’s rapid expansion has transformed its land use. The city centre, once dominated by traditional housing and colonial-era buildings, is now filled with skyscrapers, financial centres, and commercial districts. The Pudong area, which was mainly farmland, has become a modern financial hub with landmarks like the Shanghai Tower. This is reflected in the satellite images, in which the green belt around the city is more and more lost.
In the wider environment, rural areas surrounding Shanghai have been converted into industrial zones, highways, and satellite cities. Farmland has been replaced with factories and housing developments, while green spaces have been reduced. However, efforts have been made to improve sustainability, such as the development of eco-friendly industrial parks and urban greening projects.
Satellite data is useful for monitoring Shanghai’s growth and land use change. High-resolution satellite images help track urban expansion, deforestation, and land-use changes over time. Scientists and urban planners use this data to analyse the impact of development on the environment, assess pollution levels, and plan future infrastructure. Remote sensing technology also helps in disaster management, such as monitoring flooding risks in low-lying areas of the city.
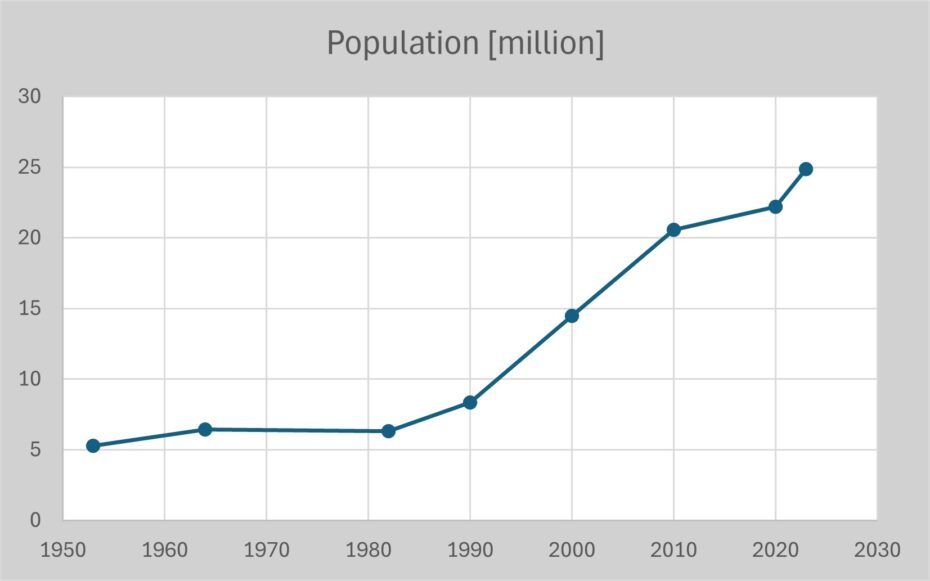
Shanghai, population development since 1953 (source: China Data Lab).
Exercises
- Satellite Map:
- Look at the satellite image from 1986 and try to identify areas with different types of land use (e.g. densely built up, agriculture, water bodies).
- Use the layer selector to switch the most recent image from 2023 on and off. Try to identify areas, where the land use has changed.
- What features and changes in the images indicate urbanization? (Think about increased road networks, reduced green spaces)
- Use the measure tool to asses Shanghai’s urban area (built up area) in 1986. Is this possible with the image from 2023, too? Based on the trends, predict one challenge the city might face in the future and suggest a solution.
- Urban expansion often reduces green spaces and farmland. Where can you find examples for this? Discuss possible environmental problems caused by Shanghai’s growth and suggest ways these problems could be addressed.
- Copernicus Browser:
- Open the Copernicus Browser.
- Find the most recent Sentinel-2 dataset covering the area displayed in the satellite map
- Select a true colour representation
- Can you identify additional, recent changes in the area (focus e.g. on the area along the coast)?
Links and Sources
| Downloads: | |
| PDF document of the case study (includes exercises): English, German, French, Italian, Spanish |
| Links: |
|