
Desert agriculture based on fossile groundwater
Saudi Arabia is one of the most arid countries in the world and is mostly covered by deserts. This goes hand in hand with a relatively low population density. While the economy of the country largely depends on the export of fossile fuels (oil and gas), it comes as a surprise that Saudi Arabia has been exporting wheat, too. With the exception of oases, agriculture in Saudi Arabia has been mostly based on extensive farming. Only with the exploitation of large fossile groundwater deposits for irrigation it was possible to intensify the production of wheat and other crops. The term «fossile groundwater» refers to the fact that in this arid environment there is only a small amount of groundwater formed every year as a result of precipitation, and the largest part of the groundwater is a remnant of much wetter times in the region several 1000 years ago.
The area around the town of Ha’il is located above a large groundwater deposit with a volume of estimated several 100 km³ water. This resource has been exploited with increasing intensity since the 1970ies. The amount of water extracted every year is estimated to be several cubic meters. While the originally applied techniques led to the quick evaporation of a large part of the water, combined with a relatively quick salination of the soil, the methods used now are better adapted to this difficult environment. Nevertheless, the use of fossile groundwater will end once the groundwater layers are depleted, which at the current use intensity is expected to happen within the next few decades.
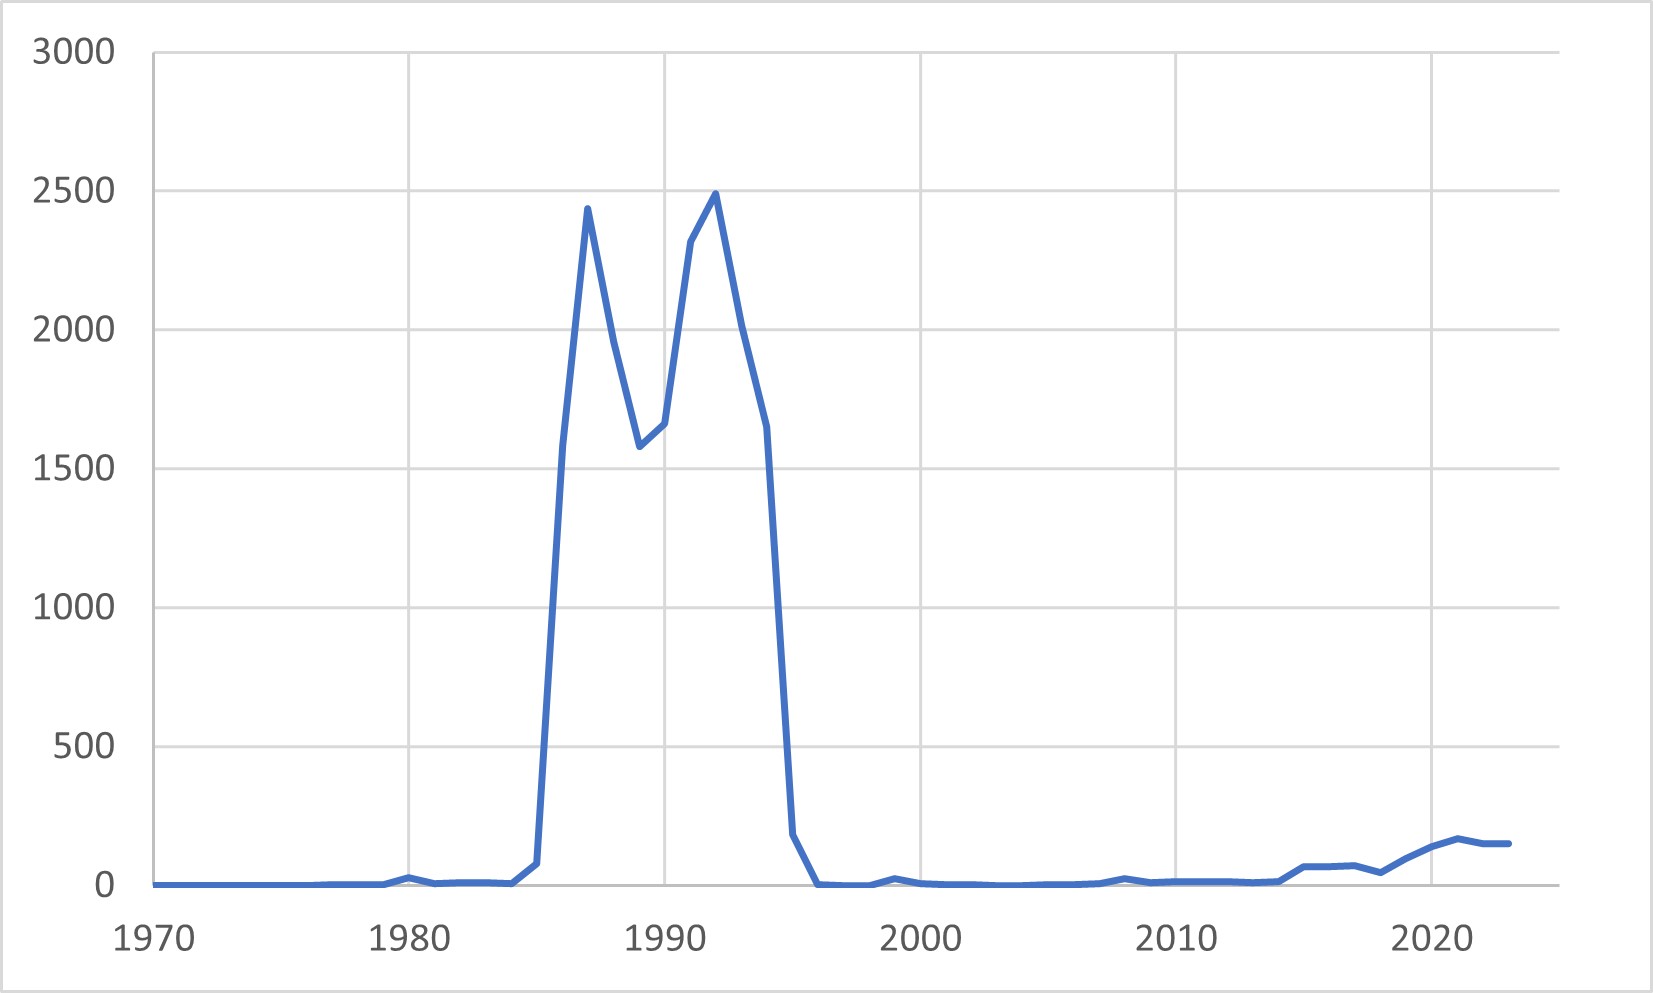
Diagram: Wheat export of Saudi Arabia (in 1000 tons)
The satellite images show an excellent contrast between vegetation and the surrounding desert, as the numerous center-pivot irrigation fields show. Therefore, they are very well suited to monitor the development of the irrigated fields and the crops cultivated. This makes it possible to use the data for crop monitoring as well as precision farming, as the analysis of data allows to tell where the supply of water and fertilizers need to be optimised.
Exercises
- Satellite Map:
- Look at the satellite image map and deselect the all satellite images by unticking the respective boxes.
- The Open Streetmap (OSM) map remains. Which land cover classes can you identify?
- Now add the satellite images one by one, starting with 1985 (lowest in the list) and continuing with 1995, 2005, 2015, and 2023. Which land cover classes can you identify? Does the number of land cover classes change?
- Toggle between the satellite images from 2023 and 1985. Where are the changes in the land cover most prominent?
- Where can you find an increase of the cultivated area, where a decrease?
- Copernicus Browser:
- Open the case study area in the Copernicus Browser.
- Find the most recent Sentinel-2 dataset covering the area displayed in the satellite map.
- Select a true colour visualisation.
- Can you identify additional, recent changes in the area (check e.g. agricultural land)?
- Select the false colour infrared representation. Can you identify the land-use of the most intensely vegetated areas (represented by bright red colours)?
Links and Sources
| Downloads: | |
|
PDF document of the case study (includes exercises): English, German, French, Italian, Spanish |
|
|
|
This case study is covered on page 63 of the printed ESA Schoolatlas – download the PDF document of the page: English, German, French, Italian, Spanish |
| Links: |
|