

Decreasing Water Levels of a Reservoir
Lake Powell is a reservoir on the Colorado River crossing the border between the U.S. states of Arizona and Utah. It was created in 1963 with the completion of the Glen Canyon Dam. The reservoir capacity is more than about 30 km³ of water. It is important for producing hydroelectric power, recreation, and for communities and farms in the Colorado River Basin.
During the last decades, Lake Powell has faced an increasingly serious water shortage as the southwestern United States has experienced a long period of drought, with higher temperatures increasing evaporation and reducing the amount of water from snow and rainfall. Water is also removed from the Colorado River for cities, agriculture, and industry.
As a result, the amount of water entering Lake Powell has often been smaller than the amount released downstream. In June 2026, about 0.38 km³ flowed into the lake, about 12% of the long-term average, while 0.63 km³ was released through Glen Canyon Dam. At the end of the month the reservoir contained only 6.9 km³, or about 24% of its capacity. By August 2026, Lake Powell was about 22% full, about two thirds of the average for that time of year. Its water level was around 1,072 m above sea level, close to the record low from April 2023 and about 55 m below its highest level.
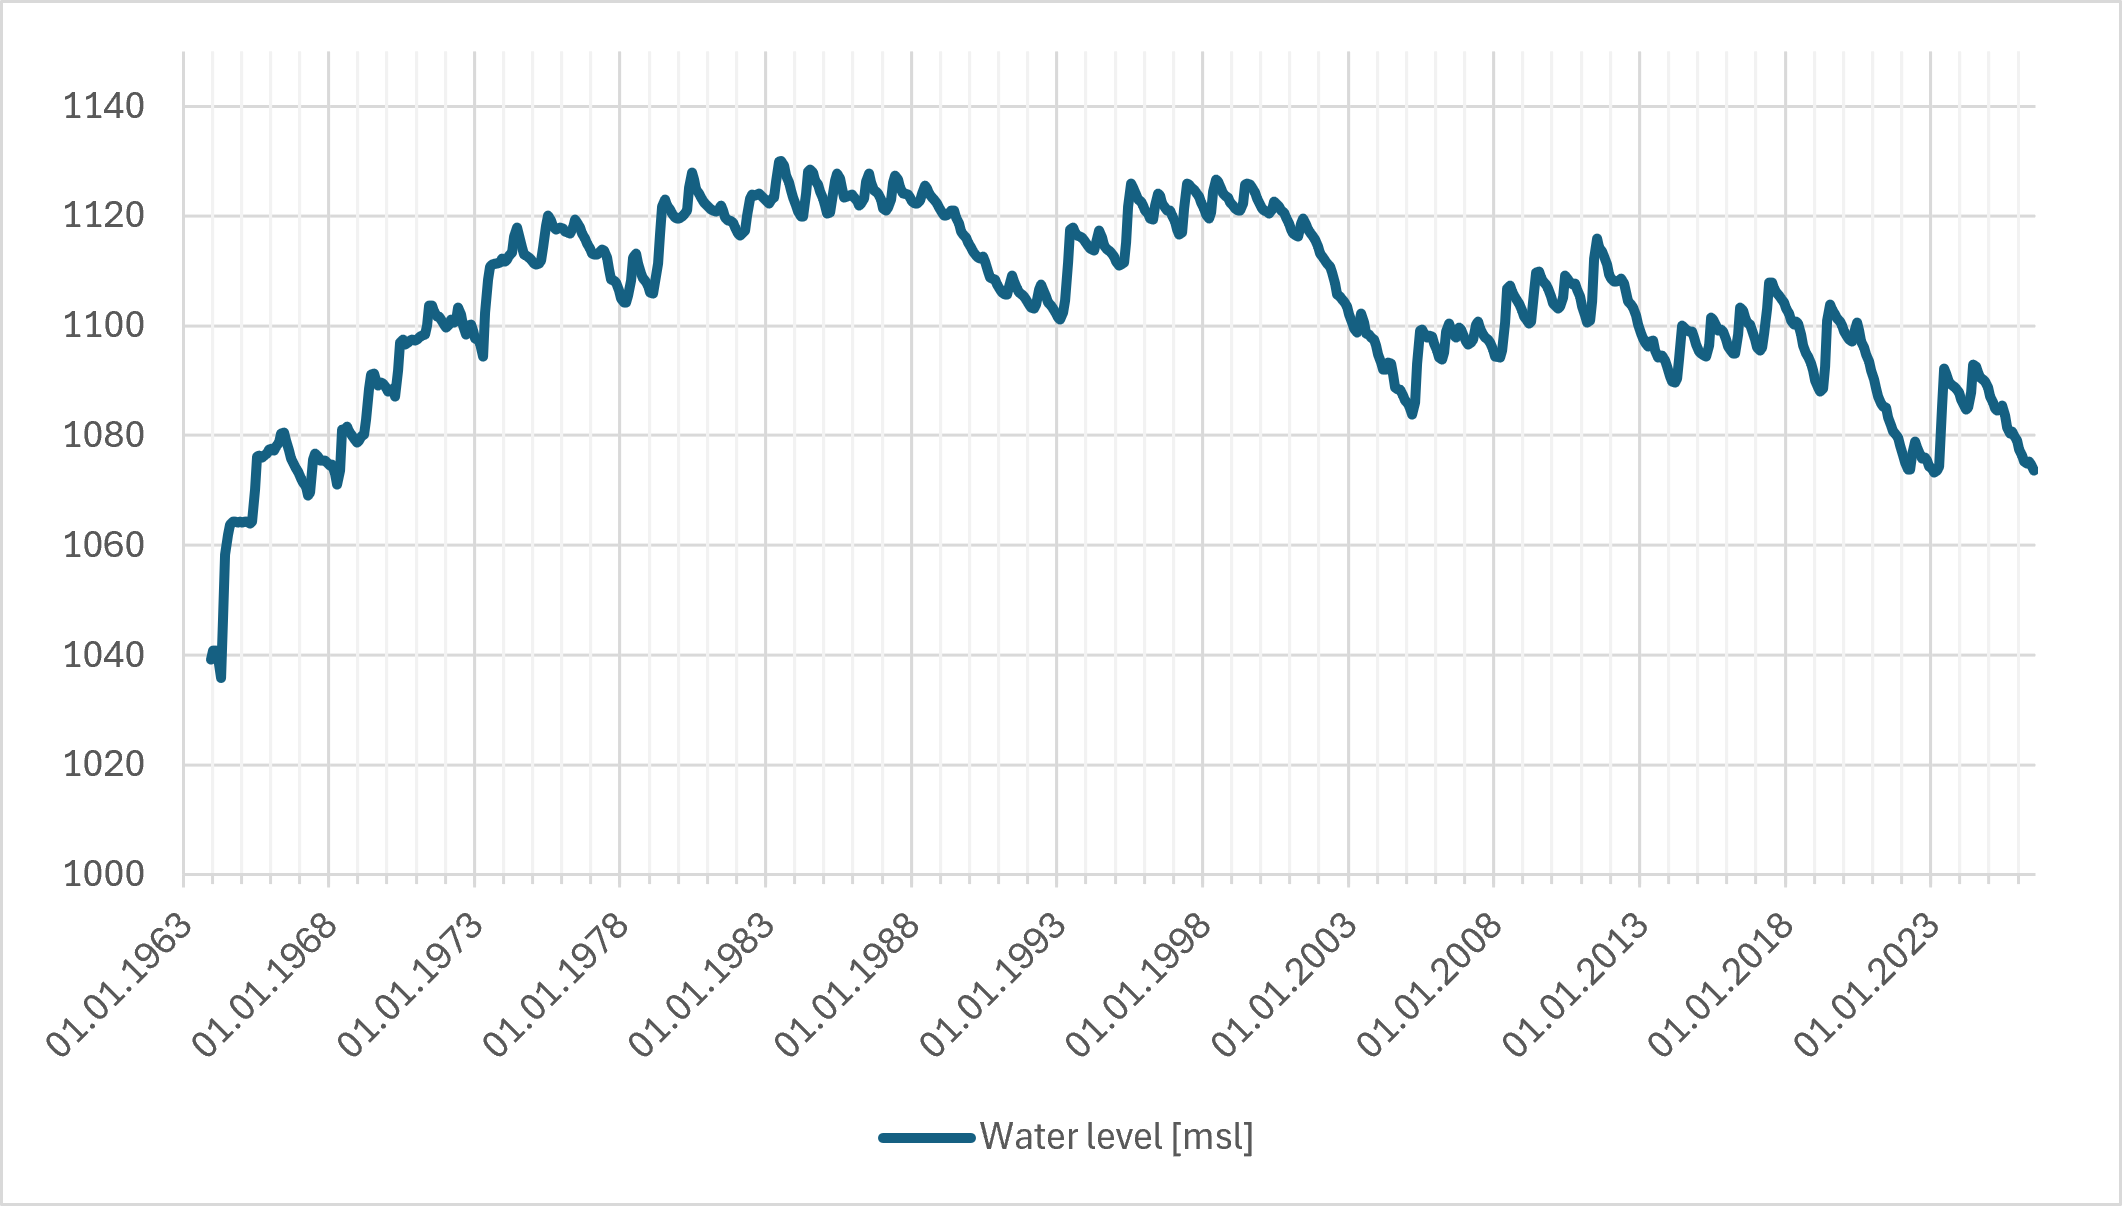
Water level of Lake Powell since it’s opening in 1963 (meters above sea level). Note the seasonal changes and the long-term changes (Data source: US Bureau of Reclamation, https://www.usbr.gov/rsvrWater/HistoricalApp.html).
Low water levels create several problems as they mean less storage and make it harder to provide supplies downstream. Falling water levels can reduce hydroelectric power generation at Glen Canyon Dam. Recreation is affected too, as boat ramps and access points can become difficult to use. Reduced water levels can expose large areas of previously submerged land, changing habitats and water quality.
Satellite remote sensing is a powerful tool to assess changes. Satellites like ESA’s Copernicus satellites repeatedly cover Earth’s surface from space. By comparing images from different years, scientists measure how the boundary of the lake moves with changing water levels. Landsat data have documented changes at Lake Powell from 1984 to the present. In addition to area measurements, satellite data of the water area is combined with elevation data to estimate changes in water volume.
Exercises
- Satellite Map:
- Look at the overview satellite image, which at launch shows the true color Sentinel-2 image from August 2016.
- Which landscape elements can you identify? Think about water bodies, valleys.
- Use the layer selector at the upper right of the map to toggle between the true color overview images from August 2016 and 2026, respectively, and describe the changes. Where are the changes in the water surface most prominent?
- Use the layer selector to toggle between the NDWI images from August 2016 and 2026. Why do you think is the discrimination between water and non-water so good? Think about the soil moisture in the arid area around the lake.
- Use the layer selector to add the vector layer Water_2016-2026 showing the change in water surfaces between 2016 and 2026 as derived from the satellite data, and compare with your findings.
- Which reasons can you imagine for the differences in the change? Think about the role of the steepness of the terrain. Compare for given water level changes the change in water surface in narrow canyons and in flat terrain, respectively.
- How can these changes influence the wildlife in this region?
- How do they affect the people living there as well as downstream?
- Use layer selector do deselect all Overview layers and select the Detail layers. Here you can add a Landsat-5 image from 1984 to extend your comparison. In how far has the shrinking of the lake changed over the last 40 years?
- Zoom to the town of Page in the southeast of the image. Can you identify the Glen Canyon Dam west of the town?
- The Landsat 5 image from 1984 shows an island north of Page, called Antelope Island. Is it still an island? Compare with the 2026 Sentinel-2 image.
- Copernicus Browser:
- Open the Copernicus Browser.
- Find the most recent Sentinel-2 dataset covering the area displayed in the satellite map.
- Select a natural colour representation.
- Zoom to the town Page in the southwestern part of the displayed area.
- Can you identify additional, recent changes in the area?
Links and Sources
| Downloads: | |
 |
PDF document of the case study (includes exercises): English, German, French, Italian, Spanish |
| Links: |
|