
Destruction as a Consequence of War
A flood disaster occurred when the Kakhovka Dam, a large hydroelectric dam on the Dnipro River in southern Ukraine, was destroyed in the context of the ongoing war in Ukraine. This event caused severe flooding, affecting settlements, farms, and ecosystems over a wide area.
Built in the mid-20th century as part of the Kakhovka Hydroelectric Power Plant, the Kakhovka Dam was more than 3 km wide and created a reservoir that held about 18 cubic kilometers of water. The reservoir supplied water for drinking, irrigation, industry, and for cooling systems at the nearby Zaporizhzhia nuclear power plant, then Europe’s largest nuclear facility.
On June 6, 2023, the dam was destroyed by explosions causing extensive damage to the structure. Both Russian and Ukrainian sides blamed each other for the destruction.
When the dam failed, the reservoir emptied quickly. Water rushed down the Dnipro River, and communities along the river were hit by flooding. Entire towns and villages were submerged, and in many places only rooftops remained above the water level. Thousands of homes were inundated, forcing tens of thousands of people to flee. Emergency services evacuated residents stranded by rising water. The floods also damaged farms, destroyed crops, and disrupted water supplies for people and for irrigation of agricultural land.
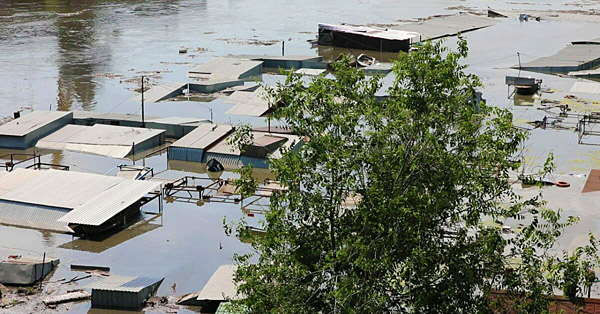
Flooded settlement downstreams after the destruction of the Kakhovka Dam (photograph: armyinform.com.ua)
In some areas, floodwater reached several meters deep. Kherson city and smaller villages downstream from the dam saw large parts of their land and infrastructure flooded.
Due to the political situation, it was difficult for journalists, scientists, and emergency workers to reach the flooded areas on the ground. Therefore, satellite data became essential for understanding the destruction. Data acquired before and after the dam’s collapse helped assess the extent of the damage. Beyond the immediate damage, the destruction of the Kakhovka Dam has longer-term consequences. Without the reservoir, water levels in canals dropped, affecting irrigation. Agricultural land risked turning dry and unusable without water. The flood released pollutants and heavy metals contained in sediments on the reservoir floor, remnants from decades of industrial use and farming.
Exercises
- Satellite Map:
- The satellite map opens with an overview Sentinel-2 image of the Kakhovka reservoir taken on 2023-05-06, before the dam was destroyed. Try to identify different landcover types. What about agricultural land, water surfaces, built-up areas?
- Try to estimate the length and area of the reservoir using the measure tool. (Note: the area of the reservoir was about 2,150 km²).
- Look at the areas surrounding the reservoir. What does the change in colour tell you about seasonal changes or about land use? Think about harvesting activities.
- The Zaporizhzhya Nuclear Power Plant is located in Enerhodar at the southern rim of the reservoir. Try to identify its location in the satellite map. Why do you think was this place selected? Think about the cooling required for the operation of this type of power plant. What can happen with a nuclear power plant if there is insufficient cooling? Do you know about disasters with nuclear power plants? Think about Chernobyl 1986 or Fukushima 2011.
- Let us now look at the situation in more detail. For this, deselect the overview Sentinel-2 image 2023-05-06_Sentinel-2_True_color using the Layer Selector. Zoom to the lower left of the satellite map, where the area around the dam is shown in a Sentinel-2 detail image from 2023-06-05 with better resolution.
- Use the Layer Selector to switch the detail images from 2023-06-20, 2023-08-04, and 2023-09-13 on and off. Try to identify changes and potential reasons for the changes. Think about destruction due to war activities, agricultural activities, and renaturalisation of areas fallen dry.
- Copernicus Browser:
- Open the case study area in the Copernicus Browser.
- Find the most recent Sentinel-2 dataset covering the area around the Kakhovka Dam displayed in the satellite map.
- Select a true colour visualisation.
- Can you identify additional, recent changes in the area?
Links and Sources
| Downloads: | |
| PDF document of the case study (includes exercises): English, German, French, Italian, Spanish |
| Links: |
|