
The ESA Schoolatlas
Project Background
Satellite technology to observe the Earth, so-called Earth Remote Sensing or Earth Observation, has become in recent decades one of the most important ways for scientists to gather and monitor a wealth of information about the status and changes of planet Earth. Earth Remote Sensing makes it possible to obtain a very complete picture of the health of the planet in important fields such as resource management, environmental and climate change monitoring, and disaster management.
Copernicus is the most ambitious Earth observation programme to date. It provides accurate, timely and easily accessible information to improve the management of the environment, understand and mitigate the effects of climate change and ensure civil security. This initiative is headed by the European Commission (EC) in partnership with the European Space Agency (ESA).
To foster a wide use of the satellite data and to make EU citizens aware of and used to its high potential, ESA has launched a large variety of activities that aim at informing teachers and students about Earth observation and providing easy access to material that can be used in lessons. In the context of these activities, in 2005 a first ESA School Atlas was published. More than 15 years later this ESA School Atlas Next Generation is published, exploiting the potential of digital maps and of an online platform.
ESA School Atlas – Next Generation
The “ESA School Atlas – Next Generation” consists of this website and a printed version, which is available in five languages (EN, DE, ES, FR, IT). Content available in both versions is referenced by the page number of the case study in the website and by a QR code in the printed atlas, respectively.
The atlas contains a wealth of case studies highlighting themes relevant in geography as well as applications of Earth observation. Accordingly, the content is structured based on the model of spheres, a colour code supports navigating the content. The spheres are:
-
- Lithosphere
- Hydrosphere
- Cryosphere
- Atmosphere
- Biosphere
- Anthroposphere
Additionally, two overarching categories cover:
-
- Climate and Climate change issues
- Basic methods of satellite remote sensing
Working with the Atlas
Accessing the case studies
On the website, the case studies are accessible in different ways:
-
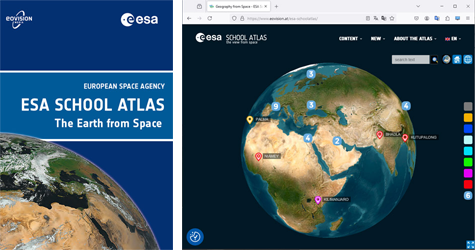
- Via the 3D globe by either zooming to the area of interest or by performing a text search, followed by clicking one of the symbols for the case studies and following the link provided in the infobox. On the globe, both the area covered by the case study and a symbol indicating the sphere most relevant to the case study are indicated.
- Via the menu listing the case studies according to the spheres and themes.
- Using the abovementioned QR code in the printed atlas to open the respective page in your browser.
Structure of the case studies
All case studies follow roughly the same structure:
-
- A web map provides possibilities to assess different satellite images and other geoinformation layers. In many cases this allows to make comparisons between different acquisition dates of satellite data.
- A short introductory text provides overview information about the background of the case study.
- Exercises based on the information layers presented in the web map can be used to assess specific information contained in these layers.
- Additional exercises make use of ESA’s satellite data tool developed in the context of the Copernicus programme, Copernicus Browser.
- Links to other relevant sources, to a large scale from ESA, allow to access material beyond that presented in the atlas.
- A download section providing the material of the case study in PDF format for offline lessons completes the case studies. This material is available as a document covering the full case study.
- Moreover, the download section provides the raw satellite data used in the case study as well as a collection of the maps used wherever it makes sense.
Working with the web maps
The web maps provide an easy access to some of the concepts of geoinformation. All web maps come georeferenced (i.e. the geographic coordinates of the cursor position are displayed in the map) and with the possibility of measuring distances within the map using the measurement tool in the upper left of the map. Both functions make it possible to easily orientate within the map.
The maps usually contain several satellite image layers that can be selected and deselected using the layer selector in the upper right of the map. Switching layers on and off allows to easily compare different datasets. For selected maps additional information layers (mostly vector layers) are available providing thematic information.
To provide a possibility for better orientation and to make it possible to directly compare with topographic maps, the OSM map is used as a base layer of the web maps. This allows for assessing topographic features in more detail.
Working with the Copernicus Browser
The Copernicus Browser is a powerful tool providing access not only to a wealth of raw satellite data, but also to a huge amount of processed satellite data presented e.g. in natural colours, false colour infrared, and many more.
The Copernicus Browser makes it possible to go back to the original raw data used in the case studies as well as to extend the case studies, both by looking beyond the area covered by the case studies and by comparing the situation presented in the case studies with other dates, especially with the most recent available acquisition dates. Currently the satellites mainly used in the atlas, Sentinel-2 and Sentinel-1, provide data from most parts of the land surface every few days.
More detailed information about the Copernicus Browser and its use in the context of education can be found here or in the user guides provided by ESA.
Additional Material
-
- Download PDF file of the printed Atlas
- About the use of the Copernicus Browser
- Glossary of the most important technical terms used in the Atlas