
Greenhouse gases from rice paddies
Atmospheric methane (CH₄) has emerged as a critical greenhouse gas during the last decades, significantly impacting climate change dynamics. While carbon dioxide (CO₂) remains the primary focus of climate discussions, methane is over 25 times more potent in trapping heat over a 100-year period, making its monitoring and management essential for mitigating global warming.
In Southeast Asia, methane emissions primarily stem from agriculture, particularly rice cultivation, livestock farming, and land-use changes, alongside fossil fuel extraction and waste management practices.
The region’s vast rice paddies are a major source of methane due to anaerobic decomposition in flooded soils. Additionally, livestock operations contribute to methane emissions through enteric fermentation. As urbanization increases, waste management issues exacerbate methane release from landfills, further enhancing its effect on climate change.
To effectively address methane emissions, satellite data has become an invaluable tool. Advanced satellite missions, such as ESA’s Sentinel-5P, provide precise measurements of atmospheric methane concentrations across vast areas. This remote sensing technology enables scientists and policymakers to track emission hotspots and evaluate the effectiveness of mitigation strategies in real-time.
By analyzing satellite data, researchers can identify trends in methane emissions linked to specific agricultural practices, urban expansion, and industrial activities. This information is crucial for developing targeted interventions, such as promoting sustainable agricultural practices and improving waste management systems. Furthermore, satellite data enhances transparency and accountability, allowing countries in Southeast Asia to fulfill their climate commitments more effectively.
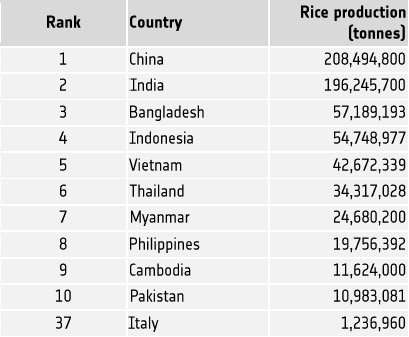
Table: Rice production per country in 2022 (Source: Food and Agriculture Organization Corporate Statistical Database (FAOSTAT), statistical data collected and maintained by the Food and Agriculture Organization FAO)
Exercises
- Satellite Map:
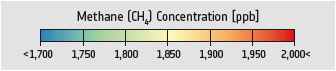
- Have a look at the two maps showing the methane concentration over Asia in January and in July 2020, respectively. Which differences can you identify?
- Looking at the map of the methane concentration in July, where can you find the highest concentrations? What might be the reason? Think about the agriculture in the region, the most important crop, and the surface relief. Hint: rice paddies require flat land or terraces and sufficient water.
- Look at the table of rice production in 2022 presented below. Where are the topmost 10 rice producing countries located? Additionally, the table gives the value for the highest ranking European country – compare this with the top producers!
Links and Sources
| Downloads: | |
|
PDF document of the case study (includes exercises): English, German, French, Italian, Spanish |
|
|
|
This case study is covered on pages 54-55 of the printed ESA Schoolatlas – download the PDF document of the page: English, German, French, Italian, Spanish |
| Links: |
|