
An abbey between ebb tide and flood
With its roots dating back to the 9th century, the UNESCO World Heritage Site Mont Saint-Michel in Normandy, France, is famous for its medieval abbey and its unique tidal environment. It attracts approximately 3 million visitors annually, making it one of the country’s most popular tourist destinations outside of Paris.
The surrounding bay is renowned for its oyster farming, particularly in the nearby town of Cancale, sometimes referred to as the “oyster capital” of Brittany. The nutrient-rich waters of Mont Saint-Michel Bay provide an ideal environment for oyster cultivation. With an annual production of approximately 130,000 tons, France is the leading European producer of oysters.
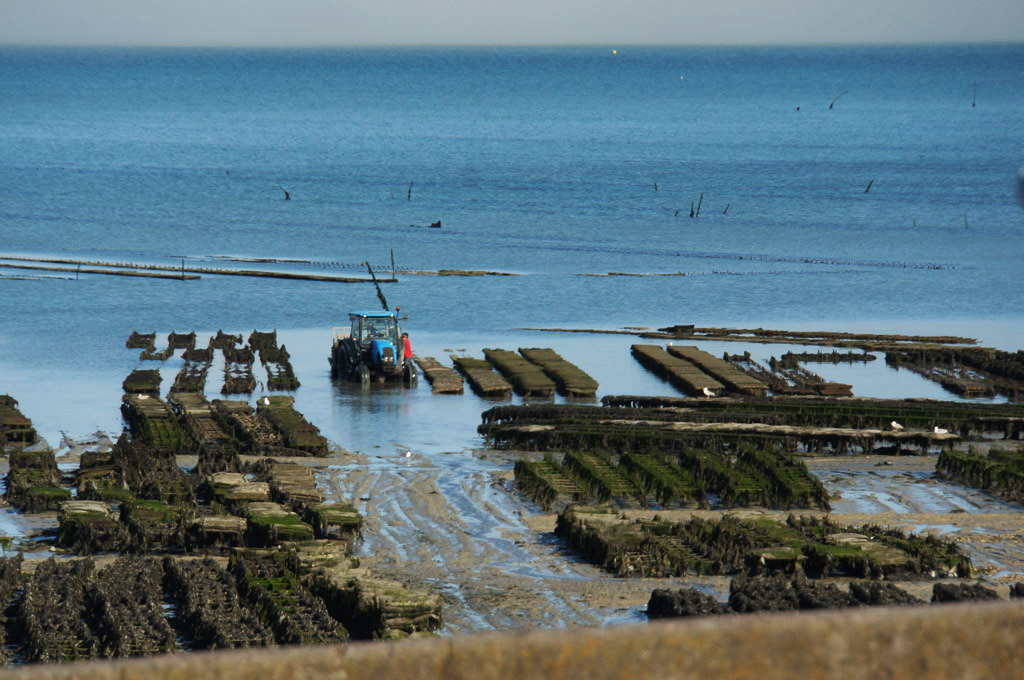
Management of oyster cultures at the coast of Brittany near Mont Saint-Michel (photo: M. Eisl)
The rocky island of Mont Saint-Michel is connected to the mainland by a causeway and is surrounded by vast sandbanks and tidal flats. The tides here are among the highest in Europe, with the sea retreating kilometres before rushing back in. This dynamic environment is similar to the Wadden Sea, a vast coastal ecosystem stretching along the Netherlands, Germany, and Denmark.
The flat coastal area consists of intertidal zones, salt marshes, and mudflats. It is one of the world’s most important ecosystems for migratory birds, providing a rich feeding ground. The coastal area changes dramatically with the tides, creating a unique and fragile habitat.
To protect these landscapes, integrated nature conservation strategies are used. At Mont Saint-Michel, efforts have been made to restore natural tidal flows by removing human-made structures that caused sediment buildup, specifically a dam that connected the island with the mainland.
Earth observation technology plays a key role in monitoring these ecosystems. Satellites track coastline changes, water levels, and biodiversity. This data helps scientists understand the impact of climate change, such as rising sea levels and habitat shifts. Remote sensing also detects pollution and human impact, allowing for better conservation planning.
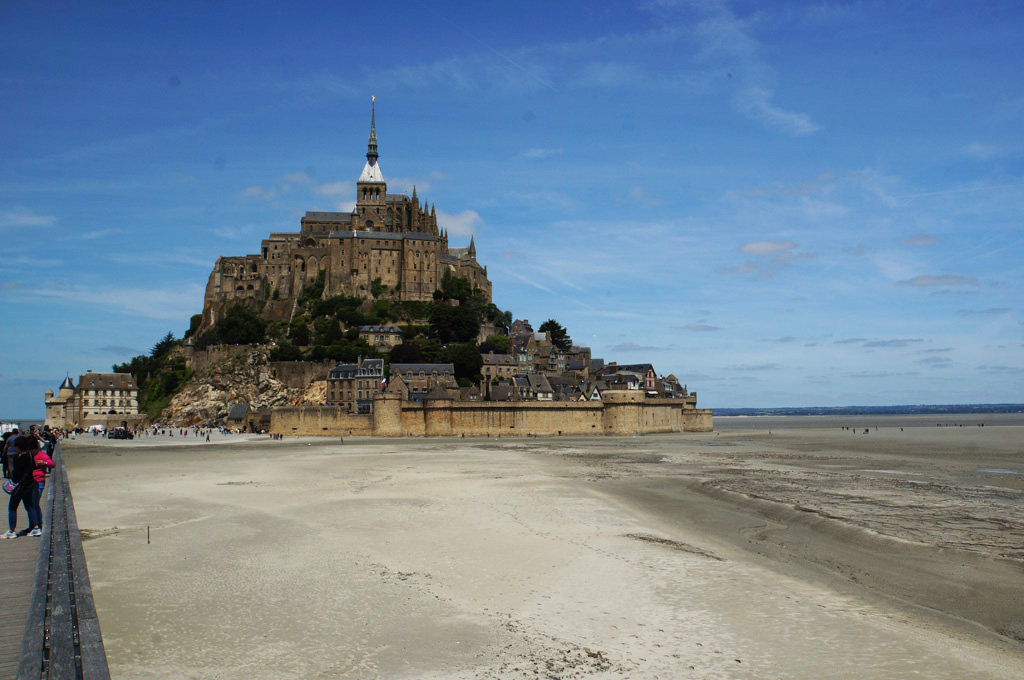
During ebb tide, the island of Mont Saint-Michel is surrounded by a vast mudplain (photograph: M. Eisl)
Exercises
- Satellite Map:
- Look at the satellite image maps and click on the layer selector in the upper right. If necessary, deselect all layers except the Sentinel-2 overview satellite image from 2023 by unticking the respective boxes.
- Describe the satellite image and try to identify land cover classes. Use the measure tool to check the distance between the city of New Orleans and the Mississippi Delta.
- Deselect the overview satellite image layer and select the “Detail True Colour” layer group. Zoom to the area covered by these images and compare the data from 1985, 1995, 2017, and 2023 by ticking/unticking the respective boxes.
- What is happening with the coastline and with the vegetation between the arms of the delta?
- Use the layer selector to deselect the “Detail True Colour” layer group and select the “Detail False Colour Infrared” layer group. Toggle between the satellite images from 1985 and 2023. Where are the changes of the coast most prominent? What reasons for the change can you imagine? Think about sediment transport by the river and erosion by the sea.
- Add the layer “coastline” and compare the changes visible here with your findings.
- Deselect the “Detail False Colour Infrared” layer group again, select the layers “Platforms” and “Pipelines“. Zoom out to show the overview satellite image again. Which potential risks can you identify that could be related to the oil production activities in the coastal region?
- Copernicus Browser:
- Open the case study area in the Copernicus Browser.
- Find the most recent Sentinel-2 dataset covering the area displayed in the satellite map. Is it easy to find (more or less) cloud-free images? Why/why not?
- Select a true colour visualisation.
- Compare the situation of the tides with that opened originally. Is there more or less of the mudplain visible? What does this tell you about the water level?
- Compare with the Satellite Map. Can you identify additional substantial changes?
- Select the NDWI (normalised difference water index). Using this visualisation, what can be easier discriminated, what more difficult?
- Select the false colour infrared representation. Can you identify the land-use of the most intensely vegetated areas (represented by bright red colours)? What can you tell about features in the water?
Links
| Downloads: | |
| PDF document of the case study (includes exercises): English, German, French, Italian, Spanish |
| Links: |
|