
Island of Fire and Ice
Iceland lies at the Mid-Atlantic Ridge, where the Eurasian and North American tectonic plates diverge, causing frequent volcanic events. Since 2023, the region around Grindavík, a town on Reykjanes Peninsula in the southwestern part of Iceland, has experienced increased volcanic activity.
After eruptions in 2021 and 2022 at Fagradalsfjall, increased seismic activity began in 2023. By November, over 15,000 earthquakes were detected in the area within a week, some of them exceeding magnitude 5.0. The quakes indicated magma movement beneath the surface, a precursor to potential eruptions. Near Grindavík a land uplift of up to 15 centimetres confirmed magma accumulation.
The so-called Sundhnúkur eruptions started on November 13, 2023, when a fissure eruption began just a few kilometres from Grindavík. The fissure extended about 1 kilometre, releasing lava at an initial rate of 20 cubic meters per second. No lava reached Grindavík, but toxic gases such as sulphur dioxide (SO2) posed health risks. Authorities evacuated around 4,000 residents and restricted access to the area. By early 2024, new eruptions occurred, with lava spouting up to 50 meters high. An eruption in May 2024 sent lava flows toward the town, destructing several homes. Emergency response teams built protective barriers. August and November 2024 saw further series of eruptions
Iceland’s geothermal energy industry, producing over 25% of its electricity, benefits from volcanic activity. Additionally, eruptions have become a major draw for tourists witnessing the dramatic landscapes. The Reykjanes Peninsula is densely populated with infrastructure critical to Iceland, including geothermal power plants and the nearby Keflavík International Airport. Damage to these facilities would have economic and energy consequences.
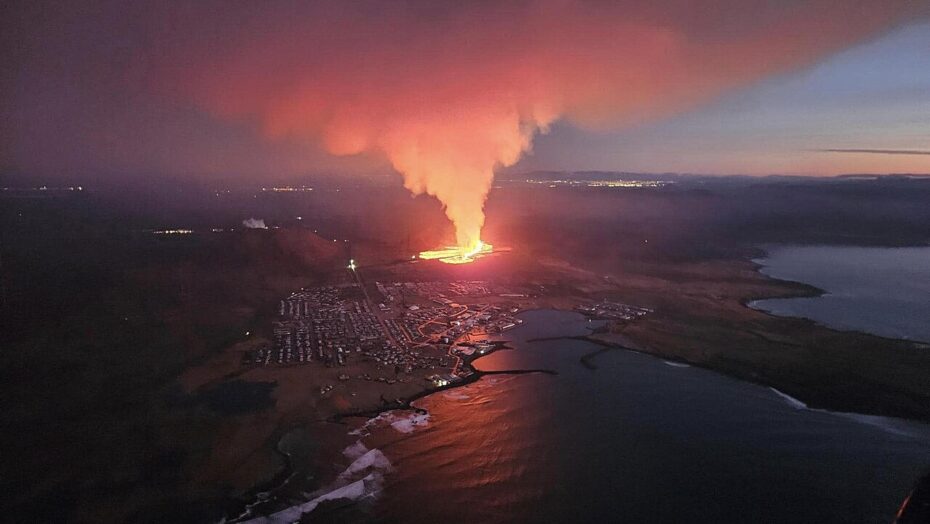
View of Grindavík and the nearby eruptions (photograph: Almannavarnadeild ríkislögreglustjóra).
Exercises
- Satellite Map:
- Look at the true colour Sentinel-2 satellite image taken in Oct. 2023 use the layer selector to add the other true colour datasets one by one. Try to identify the different land cover classes. Take the different seasons into account. What changes are caused by the eruption and the lava flow?
- Concentrate on the region north of Grindavík. Which changes can you see?
- Look at the lava field and use the measure tool to estimate the extent and the area directly covered by lava.
- Use the layer selector to compare the true colour and false colour infrared images from the different dates. Why does the lava field appear in bright colours in some of the infrared images, while the snow-covered areas appear in dark blue? Think about the relation between infrared and thermal radiation.
- For advanced readers: The eruptions accompany elevation changes and a separation of the plates around the fissure. Use the layer selector to look at the Sentinel-1 interferograms from November 2023. One cycle of the colour fringes (from red via blue to red again) corresponds to a terrain shift according to a phase difference from -180° to +180° of the used radar waves, the total shift adds up to a maximum of about 700 mm. Compare this with the average annual shift of continental plates (several mm to several cm).
- Copernicus Browser:
- Open the Copernicus Browser.
- Find the most recent Sentinel-2 dataset covering the area displayed in the satellite map.
- Select a true colour visualisation.
- Can you identify additional, recent changes in the area (check e.g. lava fields, craters)?
- Go back in time selecting earlier acquisition dates, until you reach the eruption phase covered in this case study. Can you identify more recent periods of volcanic activity?
- Select the false-colour infrared “urban” representation. Can you identify other areas of volcanic activity near Grindavík?
Links and Sources
| Downloads: | |
|
PDF document of the case study (includes exercises): English, German, French, Italian, Spanish |
| Links: |
|