
Arctic Sea Ice
Arctic sea ice, a vital component of Earth’s climate system, plays a crucial role in regulating global temperatures and sustaining biodiversity. Covering approximately 14 million square kilometres at its maximum extent in winter, it forms a reflective shield, bouncing back solar radiation and thus cooling the planet. During the summer months, Arctic sea ice shrinks to its lowest extent, reaching a minimum around September.
The vast expanse of Arctic sea ice has been diminishing in recent years, with its minimum extent during the summer months receding to around 3-4 million square kilometres. Additionally, the thickness of Arctic sea ice has decreased by more than 40% since the 1980s, primarily due to the warming effects of climate change.
The consequences of diminishing Arctic sea ice are far-reaching. Apart from contributing to rising sea levels, it also disrupts weather patterns, influences ocean circulation, and threatens the habitats of various Arctic species, including polar bears, seals, and walruses. Furthermore, the loss of sea ice opens new opportunities for shipping routes and resource extraction, intensifying geopolitical tensions in the region.
Satellite data plays an important role in monitoring and understanding the changes occurring in Arctic sea ice. Satellite technologies provide accurate measurements of ice extent, thickness, and movement, enabling scientists to track trends over time and assess the impacts of climate change with unprecedented precision. These satellite observations have revealed alarming trends, including the accelerated rate of ice loss and the emergence of thin, seasonal ice that is more vulnerable to melting. In particular, satellite data facilitates the assessment of feedback mechanisms amplifying Arctic warming, such as the albedo effect, whereby diminishing ice cover leads to increased absorption of solar radiation, further accelerating melting. This comprehensive understanding derived from satellite observations informs climate models, helping to improve projections of future sea ice behaviour and its implications for global climate dynamics.
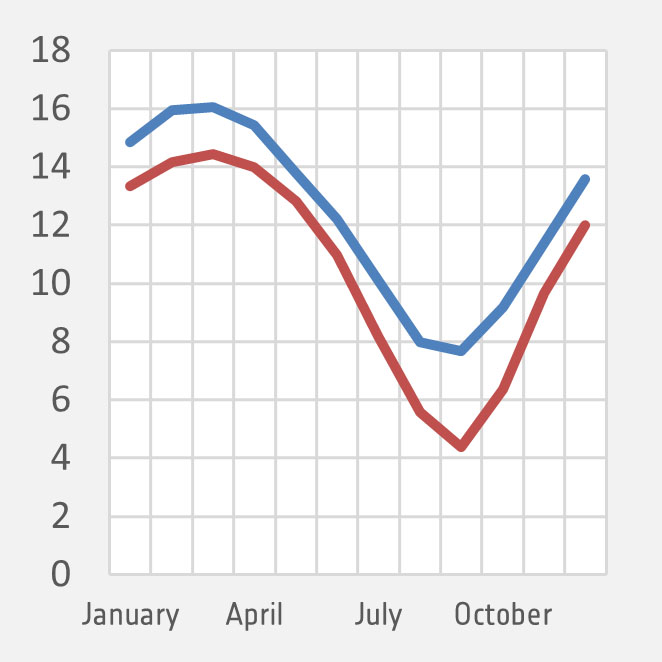
Seasonal variation of the Arctic sea ice extent in two different years (blue: 1980, red: 2023).
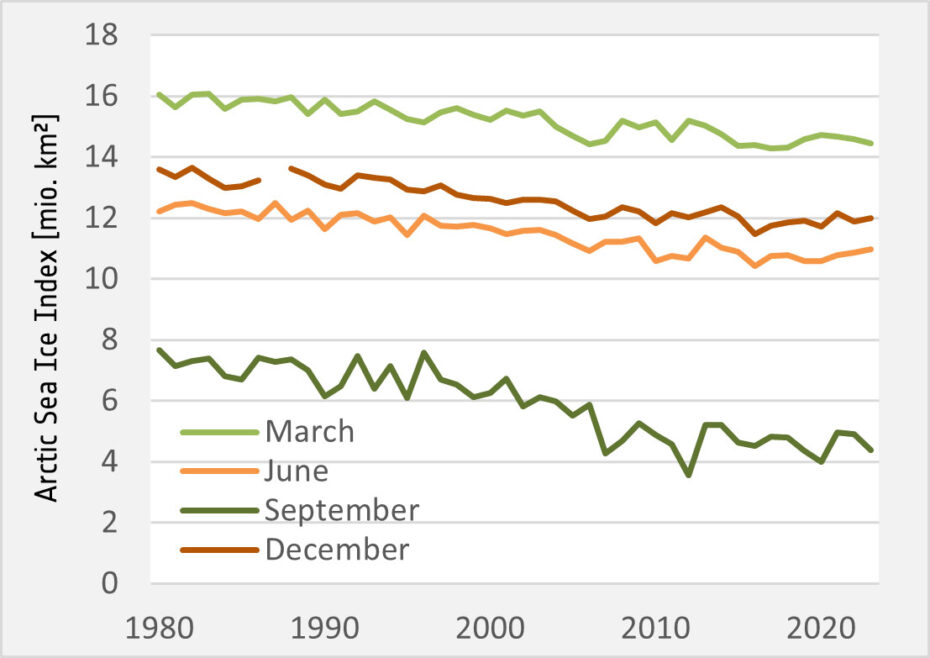
Development of the Arctic area covered by sea ice during March, June, September (the month with minimum sea ice coverage), and December.
Exercises
- Satellite Map:
- Look at the visualisation of the Arctic sea ice extent in September. Use the layer selector to select the respective sea ice extent layers and try to estimate the proportion of ice lost between 1980 and 2020.
- Compare your findings with the diagram below. Is the change in the other months shown in the diagram smaller or larger?
- What advantages and disadvantages of this ice loss can you imagine? Think about animals living in the region and about the economic potential (navigation, oil exploration).
Links
| Downloads: | |
|
PDF document of the case study (includes exercises): English, German, French, Italian, Spanish |
|
|
|
This case study is covered on page 42 of the printed ESA Schoolatlas – download the PDF document of the page: English, German, French, Italian, Spanish |
| Links: |
|