
Harvesting Wind Energy over the Sea
The Thames Estuary, located in southeastern England, has become a prominent site for the installation of offshore wind farms. These wind farms exploit the strong and consistent wind currents present in the estuary.
Their proximity to densely populated areas like London ensures efficient distribution of generated electricity, minimizing transmission losses. Secondly, the offshore location reduces visual and noise pollution compared to onshore wind farms. Offshore wind farms contribute to the renewable energy targets, helping to reduce carbon emissions and combat climate change. The development of wind farms in the Thames Estuary also poses challenges, including potential impacts on marine ecosystems and wildlife habitats.
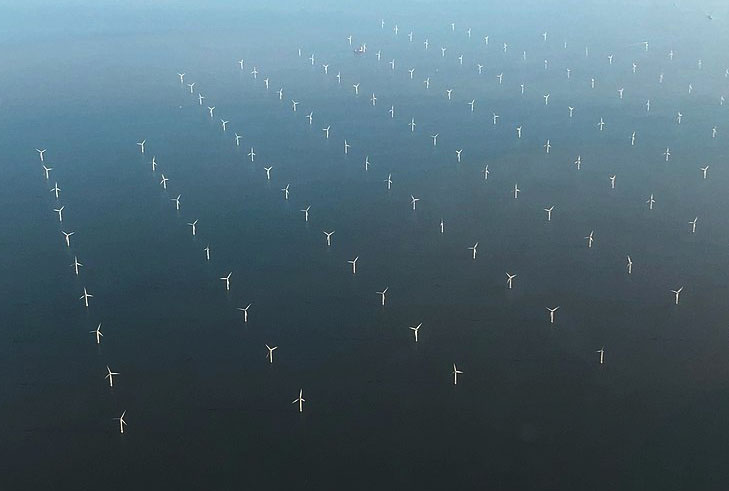 Aerial view of the London Array Windfarm (photograph: Bodgesoc)
Exercises
- Satellite Map:
- Using the layer selector, deselect all layers except the Sentinel-2 overview satellite image map and the extents of the windfarms in the Thames estuary. Try to give estimations of the area extents of the individual windfarms.
- Add now the Sentinel-1 radar image and zoom to the area covered by this iamge. Estimate the number of wind turbines visible as dots in the map. Why are many turbines required for a high-capacity windfarm?
- Select now the Sentinel-2 detail image. What is the distance between the wind turbines? Try to find reasons why they are not placed farther or closer to each other.
- Look at the colours of the water in the overview and detail Sentinel-2 images. What could be the reasons for the brownish colours? Have a special look to the detail image. How do the wind turbines influence the colour of the water? Think about sea currents.
- Think about reasons to build a windfarm at this location. Which advantages/disadvantages can you identify?
- How can windfarms influence the wildlife in this region?
- How do they affect the people living there?
- Copernicus Browser:
- Open the case study area in the Copernicus Browser.
- Find the most recent cloud-free Sentinel-2 dataset covering the area displayed in the satellite map.
- Select a true colour visualisation.
- Can you identify additional, recent changes in the wider area (check e.g. wind power installations?
- Compare with the Satellite Map. Can you identify additional substantial changes?
Links and Sources
| Downloads: | |
|
PDF document of the case study (includes exercises): English, German, French, Italian, Spanish |
|
|
|
This case study is covered on page 75 of the printed ESA Schoolatlas – download the PDF document of the page: English, German, French, Italian, Spanish |
| Links: |
|