
Shrinking Aral Sea
Since the 1960s, the Aral Sea has been shrinking dramatically. This is primarily due to the diversion of water from the two main rivers that feed it, the Amu Darya and the Syr Darya, for agricultural irrigation purposes. The Soviet Union initiated large-scale irrigation projects to cultivate cotton and other crops in the arid region, diverting water away from the Aral Sea.
The shrinking of the Aral Sea has led to environmental and social consequences. As the water level dropped, the salinity of the lake increased. Fish populations declined drastically, leading to the collapse of the fishing industry in the region. Salty dust from the dry lakebed became airborne, leading to an increase in respiratory health problems and in the incidence of other diseases. The collapse of the fishing industry and the degradation of agricultural land have economic consequences for the people living around the Aral Sea. Once prosperous fishing villages have been abandoned, leading to unemployment and poverty in the region.
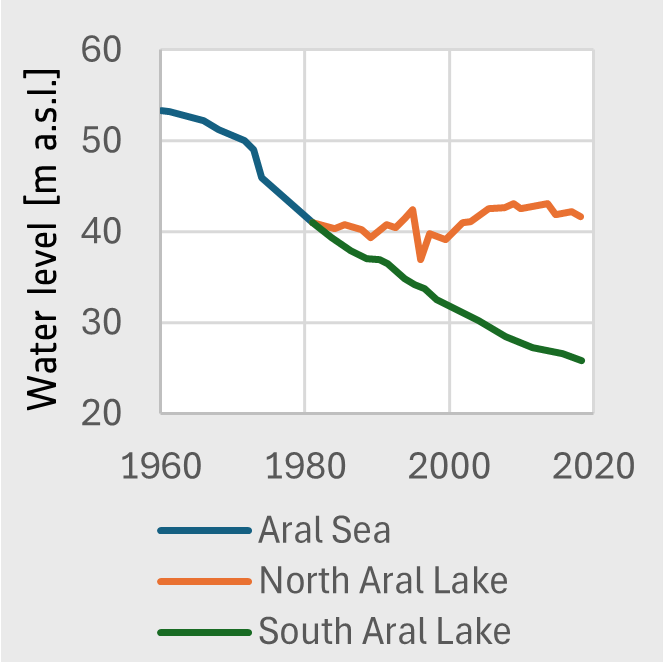
Changing water level of the northern and the southern part of the Aral Sea
Exercises
- Satellite Map:
- Look at the series of satellite image maps and try to identify the main land cover classes (e.g. water, bare land, cultivated land).
- Which changes can you identify in the areas covered by these classes?
- Think about the age of the first image taken by the Argon satellite. How old is this data? What does this tell us about the applicability of satellite data to produce long-term time series?
- Look at the false colour infrared image from 2023. In which colour does vegetation appear? What can you say about the distribution of vegetation? Focus on rivers and canals. Is this vegetation natural or cultivated?
- Look at the images below, which show the development of the water surface of the Aral Sea (left) and the water level (right). The northern part of the Lake has been stabilised by a dam. Try to identify this stabilised part and the location of the dam.
- Copernicus Browser:
- Open the case study area in the Copernicus Browser.
- Find the most recent cloud- and snow-free Sentinel-2 dataset covering the area displayed in the satellite map.
- Select a true colour visualisation.
- Can you identify additional, recent changes in the area (check especially the coastal region)?
- Select the false colour infrared representation. Can you identify the land-use of the most intensely vegetated areas (represented by bright red colours)?
Links and Sources
| Downloads: | |
|
PDF document of the case study (includes exercises): English, German, French, Italian, Spanish |
|
|
|
This case study is covered on pages 54-55 of the printed ESA Schoolatlas – download the PDF document of the page: English, German, French, Italian, Spanish |
| Links: |
|