
Tracy Arm Fjord Landslide
The 2025 Tracy Arm Fjord Landslide: Changing Landscape
Tracy Arm is a steep, glacier-carved fjord in southeast Alaska. It stretches more than 45 kilometers inland, ending at two major glaciers: South Sawyer Glacier and North Sawyer Glacier. Tall rock walls rise nearly vertically from the water, giving the fjord a dramatic appearance. For visitors it looks wild and unchanging. However, this landscape is in motion. On August 10th, 2025, a major landslide along the fjord’s northern cliff highlighted how climate and geology are linked.
A landslide occurs when rock, soil, or ice moves downhill due to gravity. The steep slopes around Tracy Arm were shaped by glaciers and are prone to slides. When a glacier melts and retreats, it removes the ice that once pressed against the valley walls. Without that support, fractured rock layers can become unstable. Over time, cracks widen, blocks shift, and whole sections of mountain can collapse.
During the years before the 2025 landslide, scientists had been documenting a rapid retreat of the South Sawyer Glacier. Warmer air and ocean temperatures caused the glacier’s front to thin and calve more frequently. As the ice pulled back, a steep rock face that had been partly supported by the glacier was left exposed. Small rockfalls occurred for years, signaling that something larger could eventually happen.
The landslide itself involved tens of millions of cubic meters of rock detaching from the fjord wall. The collapse sent a massive cloud of dust into the air and scattered rock into the water below. The immediate area was closed to boat traffic until scientists could assess the new slope and the stability of the surrounding cliffs.
Although the tsunami caused by the event was relatively small, the event still had significant consequences:
- New Landscape Features: The landslide created a fresh rock face on the fjord wall showing pale, newly exposed rock that contrasts with the older surfaces around it. Over time, weathering will darken it, and plants may take root in cracks.
- Effects on Wildlife: Seals, seabirds, and whales live along the fjord. The disturbance temporarily drove animals away from the area. Scientists observed seals returning within weeks, but some nesting bird colonies relocated farther along the fjord.
- Tourism: Tracy Arm is a popular cruise ship and small-boat sightseeing destination. After the landslide, authorities issued new safety guidelines. Ships were advised to avoid lingering near steep rock faces.
As Tracy Arm is remote and difficult to access by road, satellite monitoring is especially valuable, allowing scientists to track landscape changes in detail.
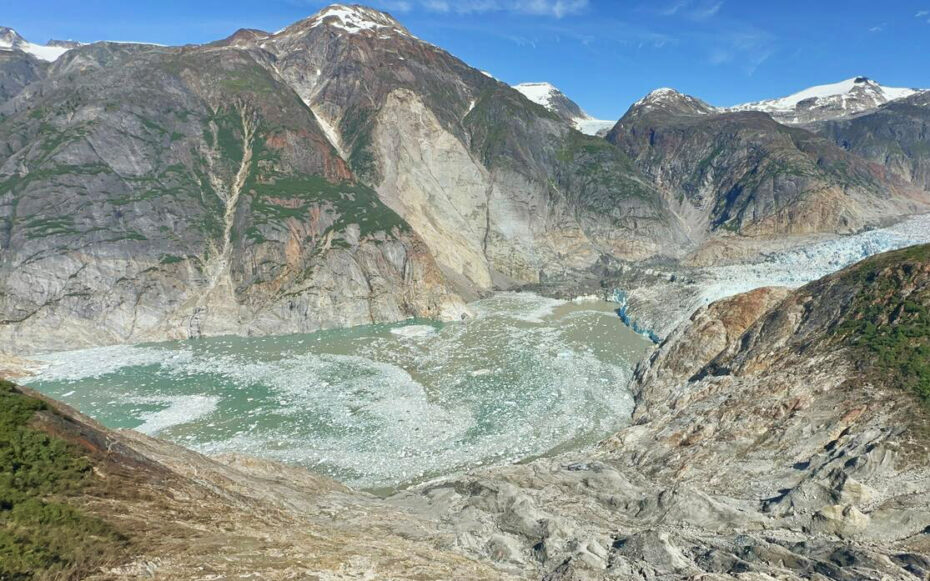
Photograph of the landslide site (Natural Hazards Mission Area, Landslide Hazards Program, Geologic Hazards Science Center, Alaska Volcano Observatory).
Exercises
- Satellite Map:
- Look at the satellite map. The true colour Sentinel-2 image of July 2025 opens.
- Try to identify important land cover classes (water surfaces, rocky areas, vegetated land, and ice/snow).
- Click on the layer selector in the upper right and switch the true colour image of August 2025 on and off. What differences can you see? Zoom to the landslide area highlighted in yellow and use the layer selector to switch the landslide area off. What immediate changes caused by the landslide can you identify?
- Looking at the satellite maps, what can you say about the relief of the terrain? Where is it rugged, where smooth? Which indicators support your findings? Think about shadows and the sun position in different times of the year!
- Look at the end of the glacier tongue in the lower right corner of the false colour infrared images from July 2025 and August 2025. What differences can you identify?
- Take a special look at the coastline and compare the situation before and after the landslide. What differences can you identify? Follow the fjord to the west. Over which distance can you see the impact of the flood wave?
- Copernicus Browser:
- Open the case study area in the Copernicus Browser.
- Find the most recent Sentinel-2 data covering the case study area.
- Use a false colour infrared representation.
- Compare the landslide area north of the end of the South Sawyer Glacier with the latest satellite image in the case study. Can you detect changes? Which reasons can you imagine? What about the vegetation cover?
Links and Sources
| Downloads: | |
| PDF document of the case study (includes exercises): English, German, French, Italian, Spanish |
| Links: |
|