
Radar Satellite Data
In contrast to optical satellites, which rely on the reflection of sunlight, radar sensors actively emit microwave pulses and measure the returned signal. This active sensing capability allows radar satellites to operate independently of external illumination by sunlight, making them suitable for a wide array of Earth observation tasks.
One key advantage of radar satellite data is its ability to penetrate cloud cover, a significant limitation in the case of optical sensors. SAR (synthetic area radar) can “see” through clouds because of its longer wavelength, providing continuous monitoring in regions prone to persistent cloud cover, such as tropical rainforests or high-latitude areas. This is particularly crucial for applications like disaster monitoring, where real-time information is essential. Radar data is unaffected by daylight conditions, enabling 24/7 monitoring. This constant observational capability proves invaluable for applications like maritime surveillance, where tracking vessels in remote or poorly lit regions can be challenging for optical sensors.
Another distinctive feature of radar data is its ability to measure topography and surface deformation with high precision. Interferometric SAR (InSAR) techniques are used to analyse the phase difference between multiple radar images, allowing for the detection of ground subsidence, elevation changes, and even millimetre-level deformations. This makes radar data indispensable for monitoring ground stability in earthquake-prone regions or tracking subtle shifts in infrastructure.
Radar data’s ability to penetrate vegetation provides a unique advantage for forestry applications. While optical sensors are limited in their ability to see through dense canopies, radar can penetrate vegetation layers and capture information about forest structure, biomass, and even detect illegal logging activities.
As for every technology, Radar data has its limitations. The spatial resolution of radar imagery is generally coarser than that of high-resolution optical data. While optical sensors can provide detailed information about surface features, radar data may lack the fine-scale detail needed for certain applications. In addition, the interpretation of Radar data is less intuitive than that of optical data, and its evaluation requires sophisticated software tools allowing to extract the subtle information of the data.
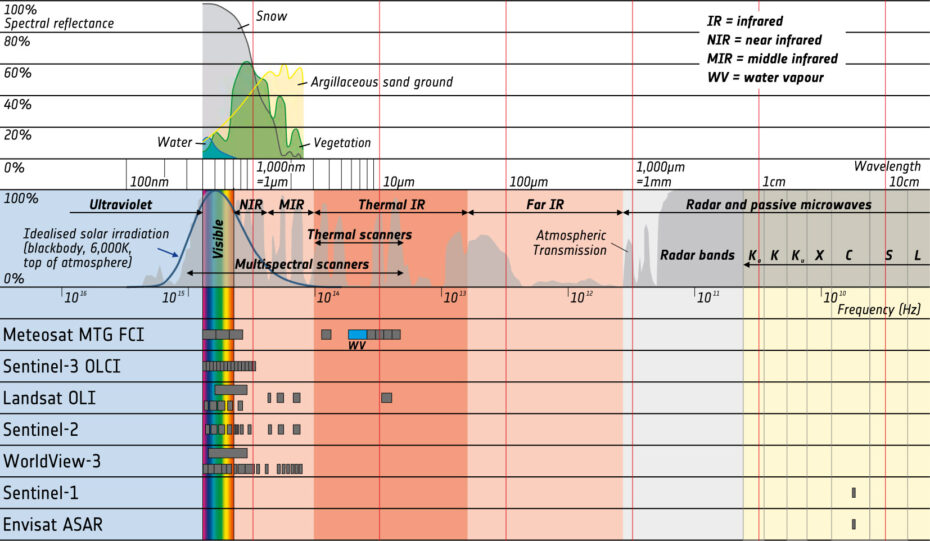
Diagram showing the electromagnetic spectrum, reflectance curves for selected land cover classes (top), the atmospheric transmission (middle), and where the bands of selected satellites are located (bottom). Note: the x-axis is logarithmic, i.e. with each red line the wavelength increases by a factor of 10. The radar sensors of Sentinel-1 and Envisat ASAR are included in the diagram.
Exercises
- Satellite Map:
- Use the layer selector to activate the different visualisations of the Sentinel-1 data in the satellite map and compare with the true-colour image by using the slider tool. Try to identify the land use and landcover classes in the region.
- Try to identify forests and built-up areas. In which of the visualisations are they best visible?
- Look at the water bodies (sea, river). How do they appear in the individual image visualisations?
- Focus on the International Airport Fiumicino (near the left edge). Does it appear dark or bright? With your knowledge about the creation of radar images, what does this mean? Is the fraction of radiation reflected to the satellite large or small? What could this mean with respect to the reflecting surface? Think about its roughness and its orientation.
- For advanced readers: have a look at the wavelength diagram above and compare the wavelengths used by optical satellites with those of the radar sensors. What are advantages/disadvantages of the respective wavelength ranges?
- Copernicus Browser:
- Open the case study area in the Copernicus Browser.
- Find the most recent Sentinel-1 dataset covering the area displayed in the satellite map.
- Toggle between the different representations of the radar data.
- Which differences can you identify between these representations?
- Which of them would you use to highlight special object classes?
Links and Sources
| Downloads: | |
|
PDF document of the case study (includes exercises): English, German, French, Italian, Spanish |
|
|
|
This case study is covered on page 19 of the printed ESA Schoolatlas – download the PDF document of the page: English, German, French, Italian, Spanish |
| Links: |
|