
Expansion into the Bay
Tokyo Bay has undergone significant development in the past five decades, driven by economic growth and urban expansion. Since the 16th century, Tokyo Bay has lost much of its original coastline due to land reclamation. Large sections of the bay were filled in to create space for industrial zones, ports, airports, and residential areas. Some of the most important reclaimed areas include Odaiba, a futuristic waterfront district, and Makuhari, a business and entertainment hub. By 2020, nearly 250 square kilometres of land had been reclaimed.
The Tokyo metropolitan area includes the Chiba Prefecture in the east and Kanagawa Prefecture with the cities of Kawasaki and Yokohama in the south. It surrounds the bay and has seen a population growth from around 26 million in 1970 to over 37 million today, making it one of the largest urban areas in the world. This rapid expansion has been fuelled by Japan’s economic boom, during which Tokyo’s GDP (gross domestic product) increased from about € 280 billion in the 1970s to over € 1,800 billion today.
One of the most famous projects in Tokyo Bay is Tokyo Disneyland, which opened in 1983 on reclaimed land in Urayasu. Another major project is Tokyo Bay Aqua-Line, a 15-kilometer tunnel-bridge highway, completed in 1997, connecting Kanagawa and Chiba prefectures to reduce congestion around the city. Additionally, Haneda Airport expanded significantly with a new international terminal, built on reclaimed land, to accommodate rising air traffic. The 2020 Tokyo Olympics also led to the construction of new stadiums and transportation networks around the bay.
Tokyo Bay’s rapid development has contributed significantly to Japan’s economy, with its port handling over 100 million tons of cargo annually. However, industrialization and urban expansion have led to pollution and habitat loss, too. Recent efforts focus on environmental restoration, such as seawater purification systems and artificial tidal flats to improve water quality and protect marine life.
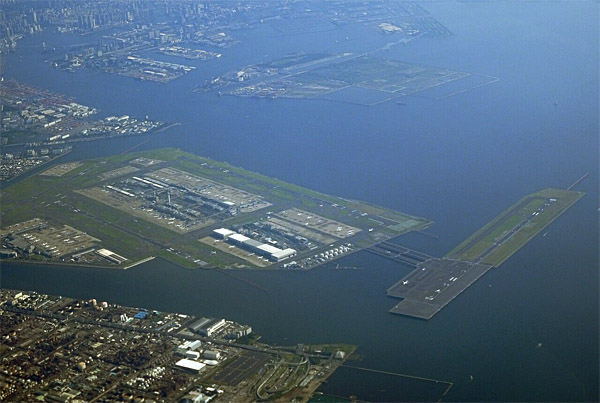
Aerial view of Haneda Airport, built on artificial islands in the Tokyo Bay (photograph: Bruno Plas).
Exercises
- Satellite Map:
- Look at the satellite image maps and discuss the changes that occurred in the region between 1973, 1984, 2017, and 2025, use the layer selector to switch the respective layers on and off.
- Which factors have originally limited the growth of the city area?
- Try to identify areas in which these limitations have been overcome and describe how this was done.
- Try to identify changes in the land-use in the region and especially the land-use in the newly gained areas.
- Try to identify the places mentioned in the text in the satellite map and focus on the development in these areas by comparing the satellite images.
- Use the layer selector to compare the quality of the satellite data – in which respect has it improved? Think e.g. about the level of detail and the spectral quality of the data. (Note: in older datasets there are sometimes errors due to transmission problems, see e.g. the 1973 image).
- Use the layer selector to activate the water area layers (1973_water etc.) one by one and try to identify when the largest development projects were performed. Use the measure tool to get an idea of the areas involved in some of these projects.
- Copernicus Browser:
- Open the case study area in the Copernicus Browser.
- Find the most recent Sentinel-2 dataset covering the area displayed in the satellite map.
- Select a true colour visualisation.
- Describe the colours of the water and try to identify factors influencing the colour. What can you say about the ship traffic in the Bay?
- Try some of the other visualisations (LAYERS) offered by the Copernicus Browser (False Color, False Color (urban), NDVI, Moisture Index, NDWI, …). Which of them do you consider useful for assessing the coastline? Why?
Links and Sources
| Downloads: | |
| PDF document of the case study (includes exercises): English, German, French, Italian, Spanish |
| Links: |
|