
A dynamic coastal region
Land use changes in the Mississippi catchment and its delta have altered both landscape and hydrology, with implications for the environment and the human population. About 80% of the original wetlands in the Mississippi River Delta have been lost due to land conversion for agriculture, urbanisation, and infrastructure development.
Around 60% of the sediment load carried by the Mississippi River is now trapped behind dams, reducing sediment delivery to the delta and exacerbating land subsidence. Urbanisation along the river has fragmented natural habitats and increased impervious surfaces, leading to higher runoff volumes and flood risks in downstream areas. The city of New Orleans, located in the Mississippi delta, is particularly vulnerable to flooding, with over 40% of its land below sea level.
The oil industry is an important economic driver in the region, with offshore drilling platforms, refineries, and petrochemical plants dotting the coastline. This industry poses environmental risks, including habitat destruction, pollution, and the potential for oil spills. The 2010 Deepwater Horizon oil spill, for example, released an estimated 4.9 million barrels of oil into the Gulf of Mexico. Hurricanes are a recurring threat to the Mississippi delta. Hurricane Katrina in 2005 and Hurricane Harvey in 2017 caused billions of dollars in damages and loss of life. Wetland loss and coastal erosion have reduced natural barriers protecting the coast, leaving communities increasingly vulnerable to storm surges and flooding.
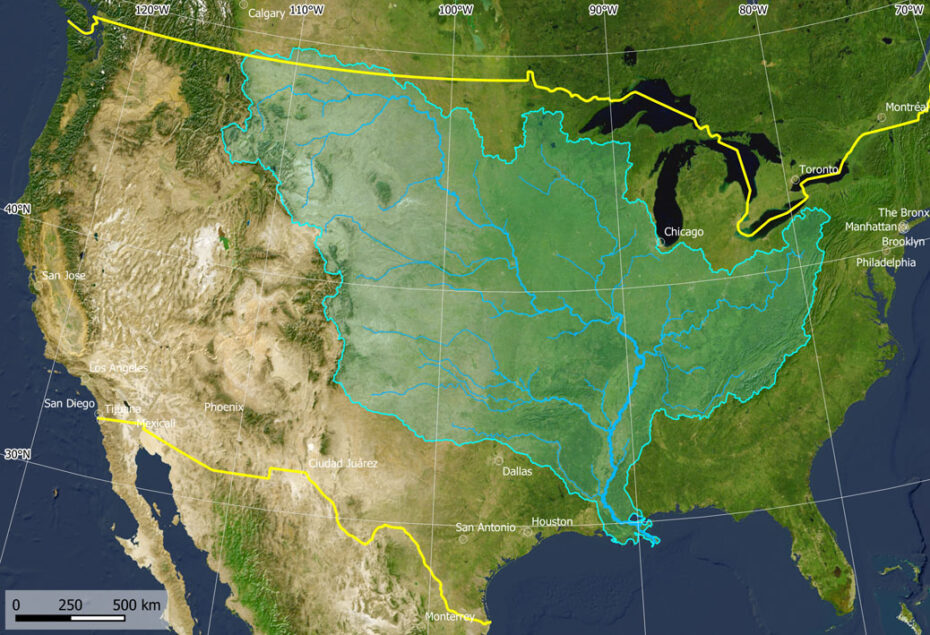
The Mississippi catchment basin covers a large part of the United States of America.
Exercises
- Satellite Map:
- Look at the satellite image maps and click on the layer selector in the upper right. If necessary, deselect all layers except the Sentinel-2 overview satellite image from 2023 by unticking the respective boxes.
- Describe the satellite image and try to identify land cover classes. Use the measure tool to check the distance between the city of New Orleans and the Mississippi Delta.
- Deselect the overview satellite image layer and select the “Detail True Colour” layer group. Zoom to the area covered by these images and compare the data from 1985, 1995, 2017, and 2023 by ticking/unticking the respective boxes.
- What is happening with the coastline and with the vegetation between the arms of the delta?
- Use the layer selector to deselect the “Detail True Colour” layer group and select the “Detail False Colour Infrared” layer group. Toggle between the satellite images from 1985 and 2023. Where are the changes of the coast most prominent? What reasons for the change can you imagine? Think about sediment transport by the river and erosion by the sea.
- Add the layer “coastline” and compare the changes visible here with your findings.
- Deselect the “Detail False Colour Infrared” layer group again, select the layers “Platforms” and “Pipelines“. Zoom out to show the overview satellite image again. Which potential risks can you identify that could be related to the oil production activities in the coastal region?
- Copernicus Browser:
- Open the case study area in the Copernicus Browser.
- Find the most recent Sentinel-2 dataset covering the area displayed in the satellite map. Is it easy to find (more or less) cloud-free images? Why/why not?
- Select a true colour visualisation.
- Can you identify additional, recent changes in the area (check e.g. forests and agricultural land)?
- Compare with the Satellite Map. Can you identify additional substantial changes?
- Select the false colour infrared representation. Can you identify the land-use of the most intensely vegetated areas (represented by bright red colours)?
Links
| Downloads: | |
|
PDF document of the case study (includes exercises): English, German, French, Italian, Spanish |
|
|
|
This case study is covered on page 39 of the printed ESA Schoolatlas – download the PDF document of the page: English, German, French, Italian, Spanish |
| Links: |
|